| Cím: | Some interesting details about freezing glycerin | |
| Szerző(k): | Gyula Radnai | |
| Füzet: | 2005/februári melléklet, 63 - 66. oldal |  PDF | MathML PDF | MathML |
|
A szöveg csak Firefox böngészőben jelenik meg helyesen. Használja a fenti PDF file-ra mutató link-et a letöltésre. Glycerin, also known as glycerine and glycerol, ( Applying the previous general relation to the case of little glycerin in a lot of water: Introducing the variable for the concentration of glycerin in the solution (in other words, its weight or mass percentage), Consider now the case when the mixture contains much more glycerin than water. In this case the freezing-point depression is Keeping the variable for the concentration of glycerin, , and so , the freezing point measured in Celsius degrees is given by Let us plot both functions, and extend formally their domains of validity up to the point where the two graphs ``meet'' (Figure 1), and then compare this diagram with real experimental data (Figure 2). 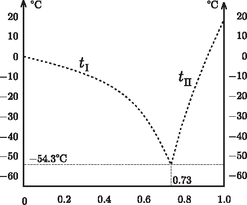 Figure 1 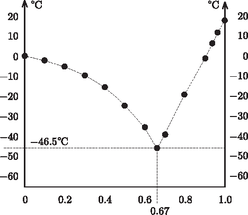 Figure 2 The similarity is striking! The unjustified extrapolation of the functions ( and ) seems to be little off. The extrapolation predicts a minimum for the freezing point of the glycerin-water mixture. True, according to measurements it is not at but rather at , and the minimum value is instead of . Nonetheless, measured data are perfectly along the theoretical curve for and stay in its vicinity afterwards, while for large values of they are along a straight line, the tangent drawn to the other end of the curve. Needless to say, the theoretical curves and are obtained from experimental data: these functions were determined using the measured values for the freezing points and latent heats of fusion of pure water and pure glycerin. The freezing-point curves of binary mixtures are usually similar to the one seen above for the mixture of water and glycerin. It is justified to call this curve the freezing-point curve: when cooling a substance, freezing starts in its points. The melting point of a pure, single-component substance is known to be identical to its freezing point: melting and freezing happen at the same temperature ‐ and this temperature remains unaltered until melting or freezing is complete. It is well known that the fundamental points of the Celsius (centigrade) scale were first determined using the temperatures of melting ice and boiling water at standard atmospheric pressure. When cooling a binary mixture (of constant composition) from the liquid phase, the appearance of the first crystalline pieces marks the freezing point. When cooling the system further, the temperature does not stay unaltered but decreases. The frozen-out crystals are made up of solvent, therefore the remaining liquid phase will become not only colder but also more concentrated. Let us examine the equilibrium phase diagram of binary mixtures on the example of the water-glycerin mixture (Figure 3). 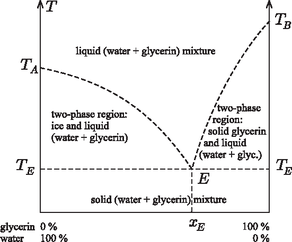 Figure 3 To a certain extent, our findings are valid for binary alloys of metal; in this context the meeting point of the two freezing-point curves is termed the eutectic point. Only for the concentration corresponding to this point (for the mixture of water and glycerin ) may the mixture freeze as one-component, pure substances do upon cooling, i.e. at a single, constant temperature . Similarly: a solid mixture of eutectic composition melts at this constant temperature upon heating. For all other concentration values temperature changes during freezing or melting. When freezing the mixture, it passes from a purely liquid state through two-component states to a perfectly solid, crystalline state ‐ with its temperature changing throughout the process! It should be noted about the binary regions that the solid phase always contains a single component, while the mass ratio of the two components in the liquid phase can be determined from the ratio of the lengths of two sections. These are obtained by drawing a horizontal line in the equilibrium phase diagram through the point representing the state in question; then one of the sections runs from the point to the freezing-point curve, and the other to the vertical axis. If one nevertheless decides to determine the freezing point of a binary mixture by sufficiently cooling it and then gradually warming it up, he should remember that in most cases the sufficiently cooled substance is not completely frozen either. When freezing the dilute aqueous solution of glycerin, water ice is formed, and concentrated glycerin solution is present in its interior as well as on its surface ‐ which is not readily seen, since its mass is very little compared to that of the ice. When the system is heated, ice starts to melt gradually, and the temperature increases. The temperature where the last tiny ice crystal melts is the freezing point. Before this should take place, interesting phenomena can be observed at somewhat lower temperatures, e.g. ice breaking up into snow-crystal-like forms. Note however that this does not happen at the characteristic temperature of the phase transition. Finally, it is worth noting that in the foregoing only equilibrium states of binary systems have been discussed. When heated or cooled too quickly, the system has no time to reach equilibrium, and in such cases so-called nonequilibrium states may be formed. The primary indicators of such states are temperature inhomogeneity (i.e., temperature at the vessel's wall is different from that at its middle) and the irreproducibility of the readings of the thermometer. In such cases it is not the thermometer that is at error: the state itself is indeterminate. It may occur even in single-component pure substances that upon rapid cooling from the liquid state the material solidifies without developing a crystalline structure. This state is the glassy or vitreous state, and the temperature where the viscosity of the material goes to infinity is called the vitrification temperature. For concentrated glycerin this is C. 1http://en.wikipedia.org/wiki/Glycerin |
 ) ranks among the most interesting liquids. According to Wikipedia, the free encyclopaedia,